
Illustration by Lucille Clerc
For centuries, humans complained about the weather. In 1848, the Smithsonian Institution decided to do something about it. Weather conditions had been considered to be either God’s will or explainable only by homespun nostrums like “Clear moon, frost soon†or by observing, say, the behavior of ants, which don’t like rain. The Farmer’s Almanac promised readers more accurate forecasts when it debuted in 1818, but even those predictions were determined by a “secret formula.†And still are.
Joseph Henry, the first Secretary of the Smithsonian, tried something new: crowdsourcing. The Institution handed out weather monitoring equipment such as thermometers, barometers and rain gauges to 150 volunteer observers across the country. Each day their localized reports arrived by telegraph, and the Smithsonian generated a national weather map that it displayed on the National Mall. The map became a popular attraction. Tourists who viewed it, Henry noted, “appear to be specially interested in knowing the condition of weather to which their friends at home are subjected at the time.â€
An amusing novelty, but no consolation for those pioneers crossing North America, the continent with some of the most violent weather on earth. Only two years before, 42 members of the Donner Party perished in an early Sierra Nevada snowfall they had no way of foreseeing.
In time the number of Smithsonian volunteers grew to more than 600. Technology improved, and slowly auditors found ways of determining what rudimentary climate data collected about the skies over Denver might soon mean to the skies over Chicago and New York as weather moved east. Reports about temperature, humidity, wind and cloud formations flooded in. Still, data didn’t always reach the right place at the right time. For example, on the Great Lakes, 97 ships were lost in one four-day gale in 1869.
Secretary of Agriculture Howard Gore, left, and Charles Marvin, chief of the U.S. Weather Bureau, view a map of weather stations, c. 1924. The bureau was the forerunner of the NWS. Library of Congress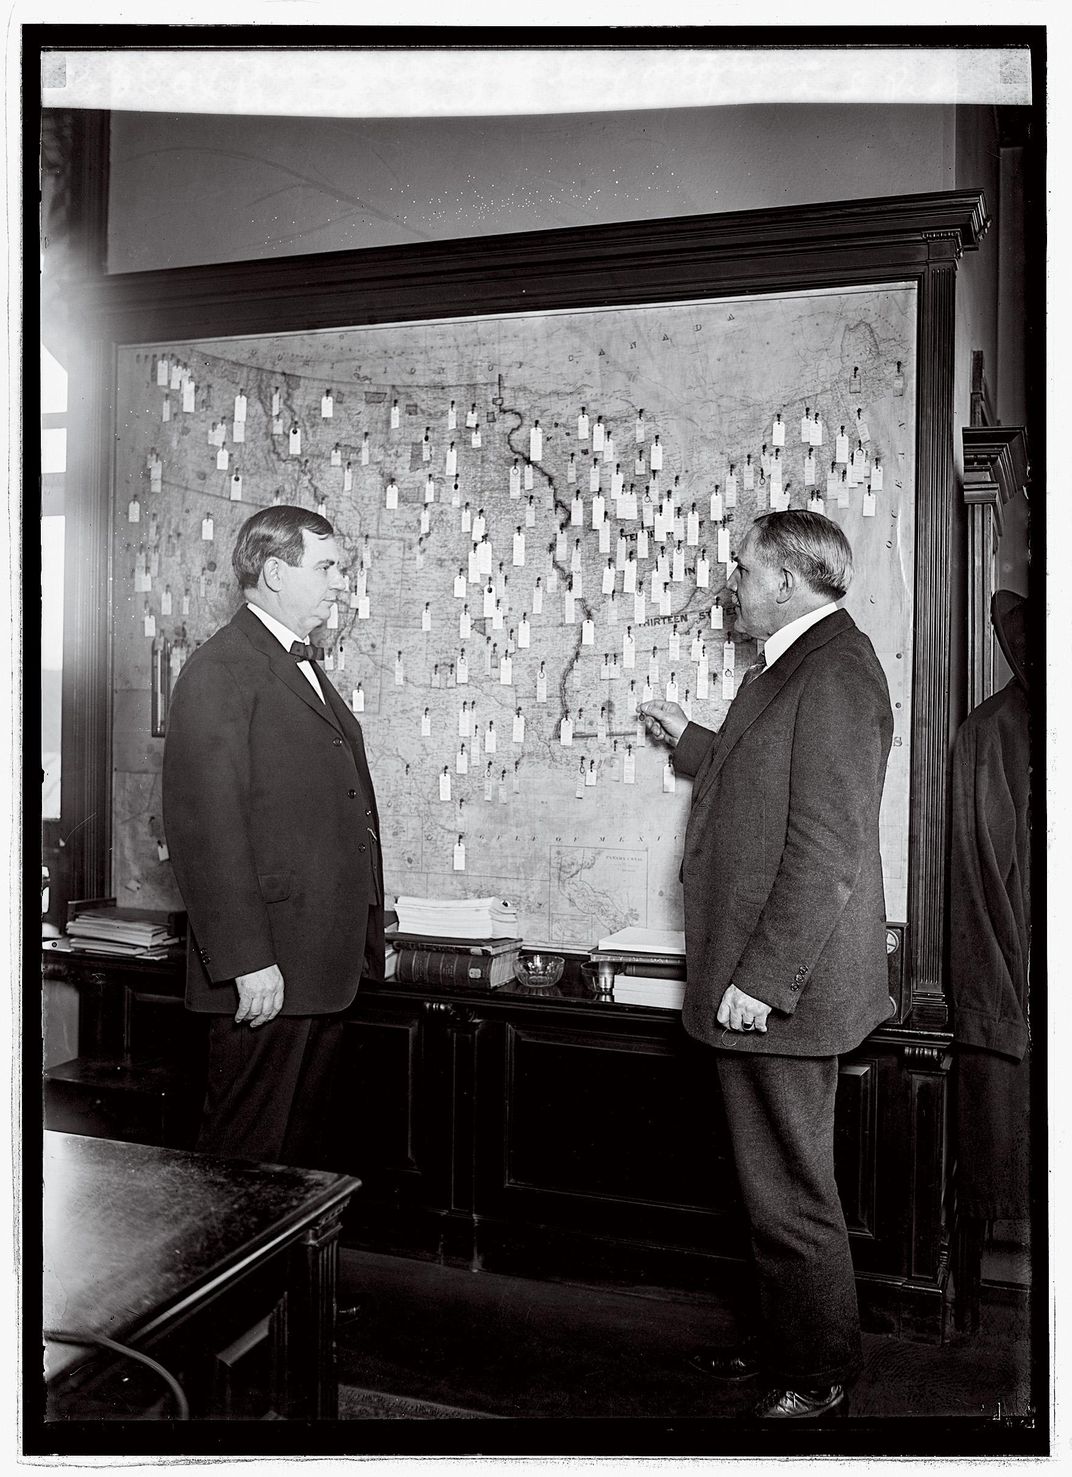
In the year following that tragedy, President Ulysses S. Grant signed a resolution into law creating the Division of Telegrams and Reports for the Benefit of Commerce. The Smithsonian’s weather observation network was turned over to the Army, which began issuing official forecasts capable of seeing, if hazily, 24 hours ahead. The threat from sudden weather disasters diminished. Ship-borne commerce vastly improved; doing business in America increasingly meant knowing the weather ahead. The division would evolve into the National Weather Service, part of the National Oceanic and Atmospheric Administration in the Commerce Department.
The first U.S. weather balloons took flight in 1909, improving the study of temperature, humidity and air pressure. Another breakthrough came in the 1920s when the balloons were equipped with radio transmitters, and real-time observation of the stratosphere became possible. For the first time, researchers observed not only the width of a weather system but also its height. During World War II, radar operators noticed patterns of interference on their screens aligned with heavy weather—and the science of radar meteorology took off, and is still in use today.
So confident were some mid-20th-century weather mavens that they speculated the heavens could be manipulated by chemically altering the atmosphere. Bespoke weather, they believed, would bring rain to farmlands, snow to ski resorts. That quixotic dream didn’t pan out, however, and Americans today are delighted to settle for smartphone weather apps, powered by NWS computer and satellite data, that give accurate information they can access instantly to stay safe. The average three-day hurricane landfall forecast can now pinpoint a much more specific swath of at-risk coastline—100 miles in 2020, compared with 300 miles in 1990—reducing the stress and cost of false alarms. Over the same period, the average tornado warning time has risen from 5 minutes to 8 to 10 minutes.
Will climate change erode our confidence in everyday weather prediction? Not in the short term, says Beth Carpenter, a meteorologist and co-founder of Thermodynamic Solutions, an Indianapolis-based firm. “Climate change itself won’t affect weather modeling because the time scales are vastly different. We are forecasting on a much smaller time scale, usually only out to three months at a time for seasonal forecasts at the longest range. Climate periods are defined as average conditions over 30 years.â€
North America’s weather is no less violent than it was when the Donner Party, oblivious, set sail in their prairie schooners before succumbing, victims of what Joseph Henry would call “the problem of American storms.†But the NWS, now with 4,000 workers, will keep finding safer ways for us to live with them. That’s a sunny forecast no matter where you are.
Some ingenious methods for getting a fix on atmospheric conditions
and even the earth’s crust
By Shi En Kim
/https://tf-cmsv2-smithsonianmag-media.s3.amazonaws.com/filer_public/96/26/962665d2-2aad-43da-82d5-6a3ecd7cf409/1_1.jpeg)
Library of Congress
/https://tf-cmsv2-smithsonianmag-media.s3.amazonaws.com/filer_public/fd/98/fd98eb2a-8c74-4248-b37e-47cc10f1aa35/4.jpeg)
Library of Congress
/https://tf-cmsv2-smithsonianmag-media.s3.amazonaws.com/filer_public/0a/74/0a7437d2-073d-455d-be5a-0880ae7912a0/6.jpeg)
Library of Congress
/https://tf-cmsv2-smithsonianmag-media.s3.amazonaws.com/filer_public/a3/70/a370ef30-43fd-4ee6-8d07-2b211ed17d31/untitled-3.jpeg)
Library of Congress
/https://tf-cmsv2-smithsonianmag-media.s3.amazonaws.com/filer_public/79/7b/797b1879-d05b-47ea-ae15-ea5f2a509b76/5.jpeg)
Library of Congress
/https://tf-cmsv2-smithsonianmag-media.s3.amazonaws.com/filer_public/c0/2f/c02f0f57-07ea-48f6-951d-ecb24d519637/2_1.jpeg)
Library of Congress
Â

Discover more from PressNewsAgency
Subscribe to get the latest posts sent to your email.